
Debug Golang Memory Leaks with Pprof

Managing memory effectively is important for the performance of any application. While Golang's garbage collector typically does an excellent job of managing memory, they can still occur. A memory leak arises when an application doesn't release memory back to the operating system, even if it's no longer in use. In large applications, these leaks can lead to Out of Memory (OOM) errors and can impact application availability.
A Golang memory leak often happens due to infinite loops, improper use of goroutines, or not releasing references to memory once they're no longer needed. In this post we'll discuss how golang pprof can be used for memory profiling and fixing leaks in Go.
Analyze the Signals
High memory usage might indicate a memory leak, but you need to confirm this first, since Linux uses an aggressive page caching mechanism which can lead to high reported memory usage (and it can be especially alarming in containerized environments where you have a fairly low resource ceiling).
Here is some key signals that can help your golang memory leak detection:
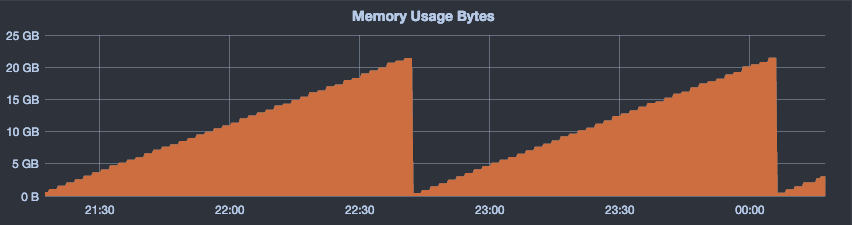
Increasing Memory Usage: Keep track of your application's memory usage over time. If the memory usage continuously rises and never decreases, you might be facing a memory leak.
Frequent Garbage Collection: If the garbage collector is running more frequently than usual and the system's memory usage remains high, this might be a sign of a memory leak. Go runtime exposes several garbage metrics like
go_memstats_gc_cpu_fraction,go_memstats_gc_sys_bytes,go_memstats_last_gc_time_seconds, etc. If the frequency of GC increases and the system's memory usage remains high, this might indicate a leak.Goroutine Count: An unexpected or uncontrolled increase in the number of goroutines can also indicate a memory leak. Goroutines are cheap but not free, and if not managed properly, they can consume a lot of memory, leading to a leak. You can track this using
go_goroutinesin your application.Application restarts: A high number of restarts for an application may indicate that it's running into memory issues. In a Kubernetes environment for example, if a pod is using more memory than its limit, the kubelet will kill the offending process to reclaim memory, resulting in a pod restart.
$ kubectl top pod POD_NAME
NAME                        CPU(cores)   MEMORY(bytes)
my-app-pod-5d9f7d56c-nfztv  153m         324Mi

$ kubectl describe pod POD_NAME
Events:
  Type     Reason     Age                From               Message
  ----     ------     ----               ----               -------
  Normal   Scheduled  50m                default-scheduler  Successfully assigned default/my-app-6d4884d985-9mb2z to minikube
  Warning  OOMKilled  15m (x2 over 20m)  kubelet            System OOM encountered, victim process: my-app, pid: 8915
  Warning  BackOff    10m (x4 over 15m)  kubelet            Back-off restarting failed container
OOM Killer: When your system runs out of memory due to excessive consumption, the Linux kernel invokes the OOM Killer to terminate processes and recover memory. These events are logged and can be viewed using the
dmesgcommand, which prints out kernel and system logs. If you see OOM Killer logs related to your application, it's a strong indication of a memory issue, potentially a memory leak.
$ dmesg | grep -i OOM
[86907.015264] Out of memory: Killed process 12345 (my-app) total-vm:162492kB, anon-rss:65320kB, file-rss:0kB, shmem-rss:0kB, UID:1000 pgtables:450kB oom_score_adj:0
[86907.341661] oom_reaper: reaped process 12345 (my-app), now anon-rss:0kB, file-rss:0kB, shmem-rss:0kB
By keeping an eye on these metrics, signals, and using the relevant commands, you can confirm whether your application is suffering from a memory leak or not.
Enable Profiling
If you have confirmed that you actually have a leak the first debugging tool to reach for should be pprof, a built-in Go library for profiling Go programs.
The net/http/pprof package allows you to serve runtime profiling data in HTTP format. To use pprof, you need to import _ "net/http/pprof" in your main package, and start an HTTP server with http.ListenAndServe.
import (
    _ "net/http/pprof"
    "net/http"
)

func main() {
    go func() {
        http.ListenAndServe("localhost:8080", nil)
    }()
    // your application code here
}
You can then use go tool pprof to interactively explore the data.
Here's a command to start a pprof session:
$ go tool pprof http://localhost:8080/debug/pprof/heap
The pprof tool provides various commands to help analyze the profile:
top: Shows you the functions that allocate the most memory.list: You can list the source code of a specific function. For example,list myFunction.web: Generates a graph of the memory allocation and the function calls.
Let's Try It!
Consider the following Go HTTP server:
package main

import (
	"fmt"
	"log"
	"net/http"
	_ "net/http/pprof"
	"sync"
)

type UserData struct {
	Data []byte
}

type UserCache struct {
	mu    sync.Mutex
	Cache map[string]*UserData
}

func NewUserCache() *UserCache {
	return &UserCache{
		Cache: make(map[string]*UserData),
	}
}

var userCache = NewUserCache()

func handleRequest(w http.ResponseWriter, r *http.Request) {
	userCache.mu.Lock()
	defer userCache.mu.Unlock()

	userData := &UserData{
		Data: make([]byte, 1000000),
	}

	userID := fmt.Sprintf("%d", len(userCache.Cache))
	userCache.Cache[userID] = userData
	log.Printf("Added data for user %s. Total users: %d\n", userID, len(userCache.Cache))
}

func main() {
	http.HandleFunc("/leaky-endpoint", handleRequest)
	http.ListenAndServe(":8080", nil)
}
In this example, the server stores data for each user in the UserCache. On every request to /leaky-endpoint, new user data is created and added to the cache. However, there's no code to remove old user data from the cache.
You can simulate the leak by bombarding the server with a large number of requests using a tool like curl or ab.
$ ab -n 1000 -c 10 http://localhost:8080/leaky-endpoint
...
Finished 1000 requests
Once the requests are completed, you can generate a heap profile by executing the following command in another terminal:
$ go tool pprof -alloc_space http://localhost:8080/debug/pprof/heap
(pprof) top
Showing nodes accounting for 521.18MB, 100% of 521.18MB total
      flat  flat%   sum%        cum   cum%
  521.18MB   100%   100%   521.18MB   100%  main.handleRequest
         0     0%   100%   521.18MB   100%  net/http.(*ServeMux).ServeHTTP
         0     0%   100%   521.18MB   100%  net/http.(*conn).serve
         0     0%   100%   521.18MB   100%  net/http.HandlerFunc.ServeHTTP
         0     0%   100%   521.18MB   100%  net/http.serverHandler.ServeHTTP
(pprof)
As we can see `handleRequest` is where the most allocations happen. It can also be confirmed by visual representation by doing
(pprof) web
Let's look at handleRequest more closely to identify where the leak comes from
(pprof) list handleRequest
Total: 521.18MB
ROUTINE ======================== main.handleRequest in /Users/codereliant/dev/code-snippets/leaky_endpoint.go
  521.18MB   521.18MB (flat, cum)   100% of Total
         .          .     28:func handleRequest(w http.ResponseWriter, r *http.Request) {
         .          .     29:	userCache.mu.Lock()
         .          .     30:	defer userCache.mu.Unlock()
         .          .     31:
         .          .     32:	userData := &UserData{
  521.18MB   521.18MB     33:		Data: make([]byte, 1000000),
         .          .     34:	}
         .          .     35:
         .          .     36:	userID := fmt.Sprintf("%d", len(userCache.Cache))
         .          .     37:	userCache.Cache[userID] = userData
         .          .     38:	log.Printf("Added data for user %s. Total users: %d\n", userID, len(userCache.Cache))
We were able to identify the exact line where the allocations happen, so now we can fix it by for example introducing the cache eviction policy.
Bonus: More Pprof Goodies
In addition to the techniques discussed earlier, pprof provides additional features and functionalities that can further enhance your profiling experience. Let's explore a few of these:
Profiling CPU Usage
You can profile your application's CPU usage using the goroutine and threadcreate profiles. To generate these profiles, you can use the following commands:
$ go tool pprof -http=localhost:8081 http://localhost:8080/debug/pprof/goroutine
$ go tool pprof -http=localhost:8081 http://localhost:8080/debug/pprof/threadcreate
These commands launch the pprof web interface for analyzing the CPU profiles. You can visualize the number of goroutines and threads created over time and identify potential bottlenecks or excessive CPU consumption.
Profiling Mutex Contention
Mutex contention can impact the performance of your application. pprof provides a profile for analyzing mutex contention. You can generate the mutex profile using the following command:
$ go tool pprof -http=localhost:8081 http://localhost:8080/debug/pprof/mutex
This command opens the pprof web interface, where you can explore the mutex profile and identify sections of code where contention occurs. By reducing mutex contention, you can improve the concurrency and overall performance of your application.
Heap Diff Profiling
Heap diff profiling allows you to compare two heap profiles to identify differences in memory allocations between two points in time. You can generate a heap profile and save it to a file using the following command:
$ curl -s http://localhost:8080/debug/pprof/heap > base.heap
After making some changes to your code or performing specific operations, you can generate another heap profile and save it to a different file:
$ curl -s http://localhost:8080/debug/pprof/heap > current.heap
To compare the two heap profiles and identify differences, use the following command:
$ go tool pprof -http=localhost:8081 --base base.heap current.heapThis command opens the pprof web interface, where you can analyze the differences in memory allocations and identify potential memory leaks or areas of improvement.
OOM errors can be daunting, but with the right tools and techniques, you can systematically trace and address them. Golang's pprof provides powerful features to understand memory utilization, making it easier to track down and fix these issues. Remember, the best way to fix memory leaks is not to have them in the first place :)